
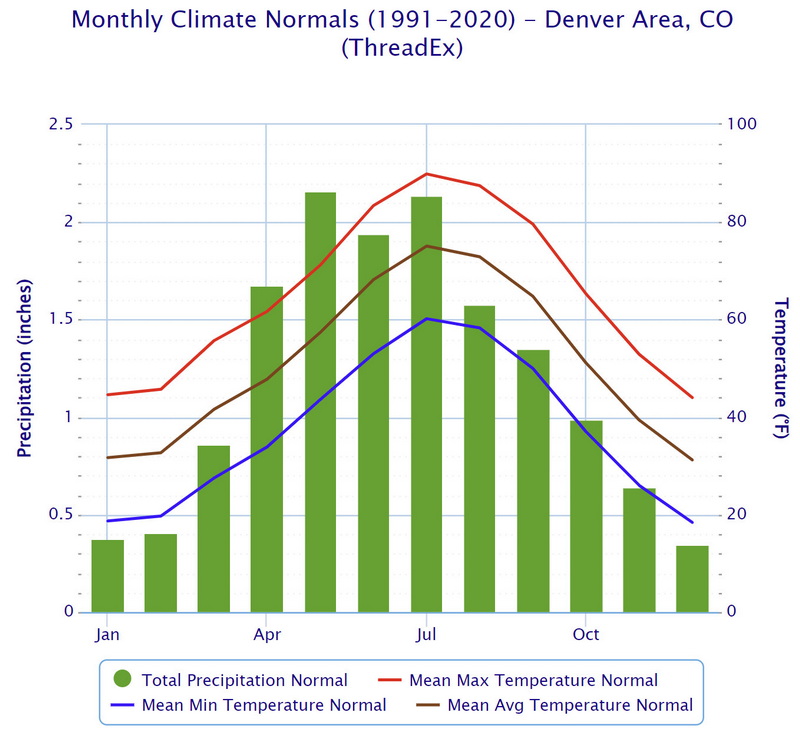
Denver Climate Normals (1991 - 2020) |
Denver Climatology Thornton Climatology |
|
Month |
Total Precipitation
Normal (inches) |
Mean Max Temperature
Normal (°F) |
Mean Min Temperature
Normal (°F) |
Mean Avg Temperature
Normal (°F) |
|
January |
0.38 |
44.6 |
18.7 |
31.7 |
|
February |
0.41 |
45.7 |
19.7 |
32.7 |
|
March |
0.86 |
55.7 |
27.5 |
41.6 |
|
April |
1.68 |
61.7 |
33.9 |
47.8 |
|
May |
2.16 |
71.2 |
43.6 |
57.4 |
|
June |
1.94 |
83.4 |
53.0 |
68.2 |
|
July |
2.14 |
89.9 |
60.2 |
75.1 |
|
August |
1.58 |
87.5 |
58.3 |
72.9 |
|
September |
1.35 |
79.6 |
50.0 |
64.8 |
|
October |
0.99 |
65.3 |
37.0 |
51.1 |
|
November |
0.64 |
52.9 |
26.0 |
39.4 |
|
December |
0.35 |
44.0 |
18.4 |
31.2 |
|
Annual |
14.48 |
65.1 |
37.2 |
51.2 |